



Key Financial Metrics Lenders and Investors Want in Your Business Plan


Jump to

You've got a meeting with a banker next month. Or an investor asked for "your financials" and you're not totally sure what that means.
You've probably downloaded a template, asked ChatGPT for a list, or skimmed a few articles that say "include a P&L, cash flow, and balance sheet." That's true. But it doesn't tell you what the person on the other side of the table does with those statements.
Here's the short version: lenders and investors read your financial plan looking for different answers. Lenders want to know if you can repay. Investors want to know if you can grow. This guide covers the financial metrics lenders want to see, the ones investors look for, and how to make your numbers hold up when someone starts asking questions.
Quick answer: What financial metrics do lenders and investors want to see?
Lenders want a projected profit and loss statement, cash flow statement, and balance sheet (usually monthly for the first two years, annually for years three through five), plus your debt service coverage ratio, current ratio, debt-to-equity, equity injection, and personal financial statements. Existing businesses also need two to three years of historical financials.
Investors want the same three statements, but they focus on revenue growth rate, gross margin, burn rate and runway, unit economics (customer acquisition cost and lifetime value), and exactly how their money will be spent.
What financial reports do lenders want to see?
Every lender, from your local bank to an SBA 7(a) lender, starts with the same core package. If any piece is missing, the conversation stalls.
1. Projected profit and loss statement. Also called an income statement or P&L. It shows revenue, costs, and profit over time. Lenders use it to see whether the business earns enough to cover a loan payment.
2. Projected cash flow statement. This shows when cash actually comes in and goes out. It's the statement lenders lean on hardest, because you repay loans with cash, not profit.
3. Projected balance sheet. A snapshot of what the business owns (assets), owes (liabilities), and what's left for the owners (equity). Lenders use it to judge how leveraged you already are. Here's how to read one.
4. Historical financials (if you're already operating). Most lenders want two to three years of tax returns or financial statements, plus year-to-date interim statements.
5. Personal financial statements. For small business loans, lenders look at you, not just the business. Expect to list personal assets, debts, and income for every owner with 20% or more of the company.
6. Use of funds. A clear breakdown of how much you're requesting and exactly what it pays for: equipment, build-out, inventory, working capital.
How far out should projections go? SBA lenders typically ask for monthly projections for the first two years and annual projections for years three through five. More in our guide to writing an SBA business plan.
One detail trips up a lot of first-time borrowers: the loan itself has to show up in your forecast. The cash you receive appears on the cash flow statement and balance sheet. The loan balance is a liability. Interest hits your P&L, and principal payments reduce cash every month for the life of the loan. If the loan isn't modeled, a lender will notice right away.

The financial metrics lenders actually calculate
Lenders don't just read your statements. They pull specific numbers out of them and compare those numbers against their underwriting rules. Know these before you walk in.
Debt service coverage ratio (DSCR)
This is the big one. DSCR tells a lender whether your business generates enough cash to make its loan payments, with room to spare.
DSCR = Net Operating Income ÷ Total Annual Debt Payments
Say you're opening a coffee shop and requesting a $250,000 loan over 10 years. At roughly 11% interest, your payments come to about $41,300 a year. If your forecast shows $55,000 in net operating income, your DSCR is 1.33.
That means you earn $1.33 for every $1.00 you owe. The SBA requires a minimum of 1.15 for 7(a) loans, and many conventional lenders look for 1.25 or higher. A DSCR below 1.0 means the business can't cover its payments from operations, and that's usually a non-starter.
Not sure which loans you'd qualify for? LivePlan's free Business Loan Finder asks a few questions about your business and personal finances, then shows which options are likely a good fit, from SBA 7(a) and bank loans to CDFIs and investors.
Current ratio
The current ratio measures short-term liquidity: can you pay the bills coming due in the next 12 months?
Current Ratio = Current Assets ÷ Current Liabilities
A landscaping company with $90,000 in cash, receivables, and inventory and $60,000 in bills due this year has a current ratio of 1.5. Lenders compare this to industry norms, but a ratio below 1.0 is a warning sign almost everywhere.
Debt-to-equity
This shows how much of the business is funded by borrowing versus by the owners.
Debt-to-Equity = Total Liabilities ÷ Owner's Equity
A high number tells a lender you're already stretched. Some lenders use a stricter version, debt to tangible net worth, which strips out intangible assets like goodwill.
Equity injection
Lenders want to see you have skin in the game. For SBA loans to startups and business acquisitions, the minimum owner contribution is generally 10% of total project costs. Conventional lenders often expect more.
Show this clearly in your plan: where the money comes from (savings, home equity, a partner) and where it goes.
Gross margin
Gross Margin = (Revenue − Cost of Goods Sold) ÷ Revenue
Gross margin tells a lender whether your pricing works. If a bakery sells a $4 croissant that costs $1.40 to make, its gross margin is 65%. Lenders compare your margin to industry benchmarks. If yours is way above average, expect to explain why.
Break-even point
Your break-even point is how much you need to sell to cover all your costs. Lenders like it because it shows how much cushion you have between your forecast and failure.
Break-Even Revenue = Fixed Costs ÷ Contribution Margin %
A restaurant with $5,000 in monthly fixed costs and a 50% contribution margin needs $10,000 a month in sales to break even. If the forecast shows $30,000, that's a comfortable margin of safety. If it shows $11,000, a lender will get nervous. Here's a deeper look at break-even analysis.
What financial metrics do investors look for?
Investors read the same three statements, but they're asking a different question. A lender's best outcome is getting paid back. An investor's best outcome is a business that's worth 10 times more in five years.
That changes what they focus on.
Revenue growth rate. How fast does revenue grow month over month or year over year? Investors want to see a credible path to scale, not a flat line.
Gross margin. Same formula as above, but investors use it to judge how much each new dollar of revenue is worth. High-margin businesses scale more profitably.
Burn rate and runway. Burn rate is how much cash you spend each month. Runway is how long until you run out.
Runway (months) = Cash on Hand ÷ Monthly Net Burn
A software startup with $600,000 in the bank burning $50,000 a month has 12 months of runway. Investors want to know your raise covers enough runway to hit your next milestone, with buffer. Learn how to calculate your burn rate.
Unit economics. What does it cost to get a customer (customer acquisition cost, or CAC), and how much is that customer worth over time (lifetime value, or LTV)? A common rule of thumb is that LTV should be two to three times CAC.
Use of funds tied to milestones. Investors don't just want to know you'll spend $500,000. They want to know what that money buys: "Two engineers and a sales hire for 18 months, which gets us to $1M in annual recurring revenue."
How to present a budget to investors
Investors will ask to see your budget, and they read it differently than you do. Keep these in mind:
- Lead with the summary. Show total spend by category (people, marketing, product, operations) before the line-item detail.
- Tie spending to outcomes. Every major line should connect to a milestone in your plan.
- Show headcount separately. Payroll is usually the biggest expense. A clear personnel plan shows who you'll hire, when, and at what cost.
- Include a downside case. What happens if revenue comes in 30% lower? Showing you've thought about it builds more trust than a single rosy forecast.
Lenders vs. investors: what each one wants
Lenders | Investors | |
|---|---|---|
Core question | Can you repay? | Can you grow? |
Statements | P&L, cash flow, balance sheet | P&L, cash flow, balance sheet |
Projection length | Monthly for years 1 and 2, annual for years 3–5 | 3–5 years, often monthly until profitability |
Key metrics | DSCR, current ratio, debt-to-equity, equity injection | Growth rate, gross margin, burn rate, runway, CAC/LTV |
Looks at you personally | Yes: credit, personal financial statement, collateral | Yes: team and track record |
Biggest red flag | Cash flow that can't cover payments | Growth story that doesn't match the numbers |
Common questions about business plan financials
No. A P&L shows whether you made a profit over a period. A cash flow statement shows whether you actually have cash in the bank.
The gap comes from timing. A consulting firm that lands a $50,000 contract books the revenue when the work is done. But if the client pays in 90 days, that cash isn't there to make payroll next week. Lenders care about both, but they repay loans from the cash flow statement.
No. You can be profitable and still run out of cash, especially if customers pay slowly, you carry inventory, or you're making loan principal payments (which reduce cash but aren't an expense on your P&L). More on how cash flow works.
Not quite. A forecast predicts what you think will happen: sales, costs, and cash. A budget sets what you plan to spend. In a business plan, your budget lives inside your forecast as the expense side. Investors often ask for both. See how to create a business budget in 7 steps.
They want the same statements, but not the same metrics. Lenders focus on repayment: DSCR, liquidity, and leverage. Investors focus on growth: revenue growth, margins, burn rate, and unit economics. See the comparison table above.
Close, but no. Gross margin subtracts only cost of goods sold. Contribution margin subtracts all variable costs, including things like sales commissions or payment processing fees. Contribution margin is what you use for break-even analysis.
Often, but not always. Operating income is revenue minus all operating expenses, including depreciation and amortization. EBITDA adds depreciation and amortization back in. For a small business with few fixed assets, the two numbers may be nearly identical.
For an internal plan, no. For a loan application, you don't always need to list them, but the lender will calculate them anyway. It's better to know your DSCR and current ratio before they do, so nothing surprises you in the meeting. Once you're operating, these 5 financial ratios help you track business risk.
How to make your numbers hold up to scrutiny
Funders don't expect your forecast to be perfect. They expect it to be defensible. When a lender asks, "Where does this number come from?" you need an answer.
Show your assumptions. Don't just list $400,000 in year-one revenue. Show the math: 120 customers a day, $9 average ticket, 310 operating days. Assumptions a lender can check are assumptions a lender can believe.
Benchmark against your industry. If your gross margin is 75% and the industry average is 60%, either explain why or revisit the number. Outliers draw questions.
Make sure the statements agree. Your sales forecast should feed your P&L. Your P&L and balance sheet should drive your cash flow. When numbers don't tie out across statements, funders lose confidence fast.
Stress-test before you present. Run a version with slower sales and higher costs. Does the business still cover its loan payments? Does your runway still reach the next milestone?
This is the Validate and Refine part of The LivePlan Method. You build the plan, check it against real benchmarks and tough scenarios, adjust what doesn't hold up, and only then present it. A plan that's already survived your own hard questions is far more likely to survive a lender's.
Build a funding-ready forecast without the spreadsheet headaches
ChatGPT can give you a list of metrics. A spreadsheet can hold the numbers. But getting three financial statements to tie together, with a loan modeled correctly, is where most DIY forecasts break.
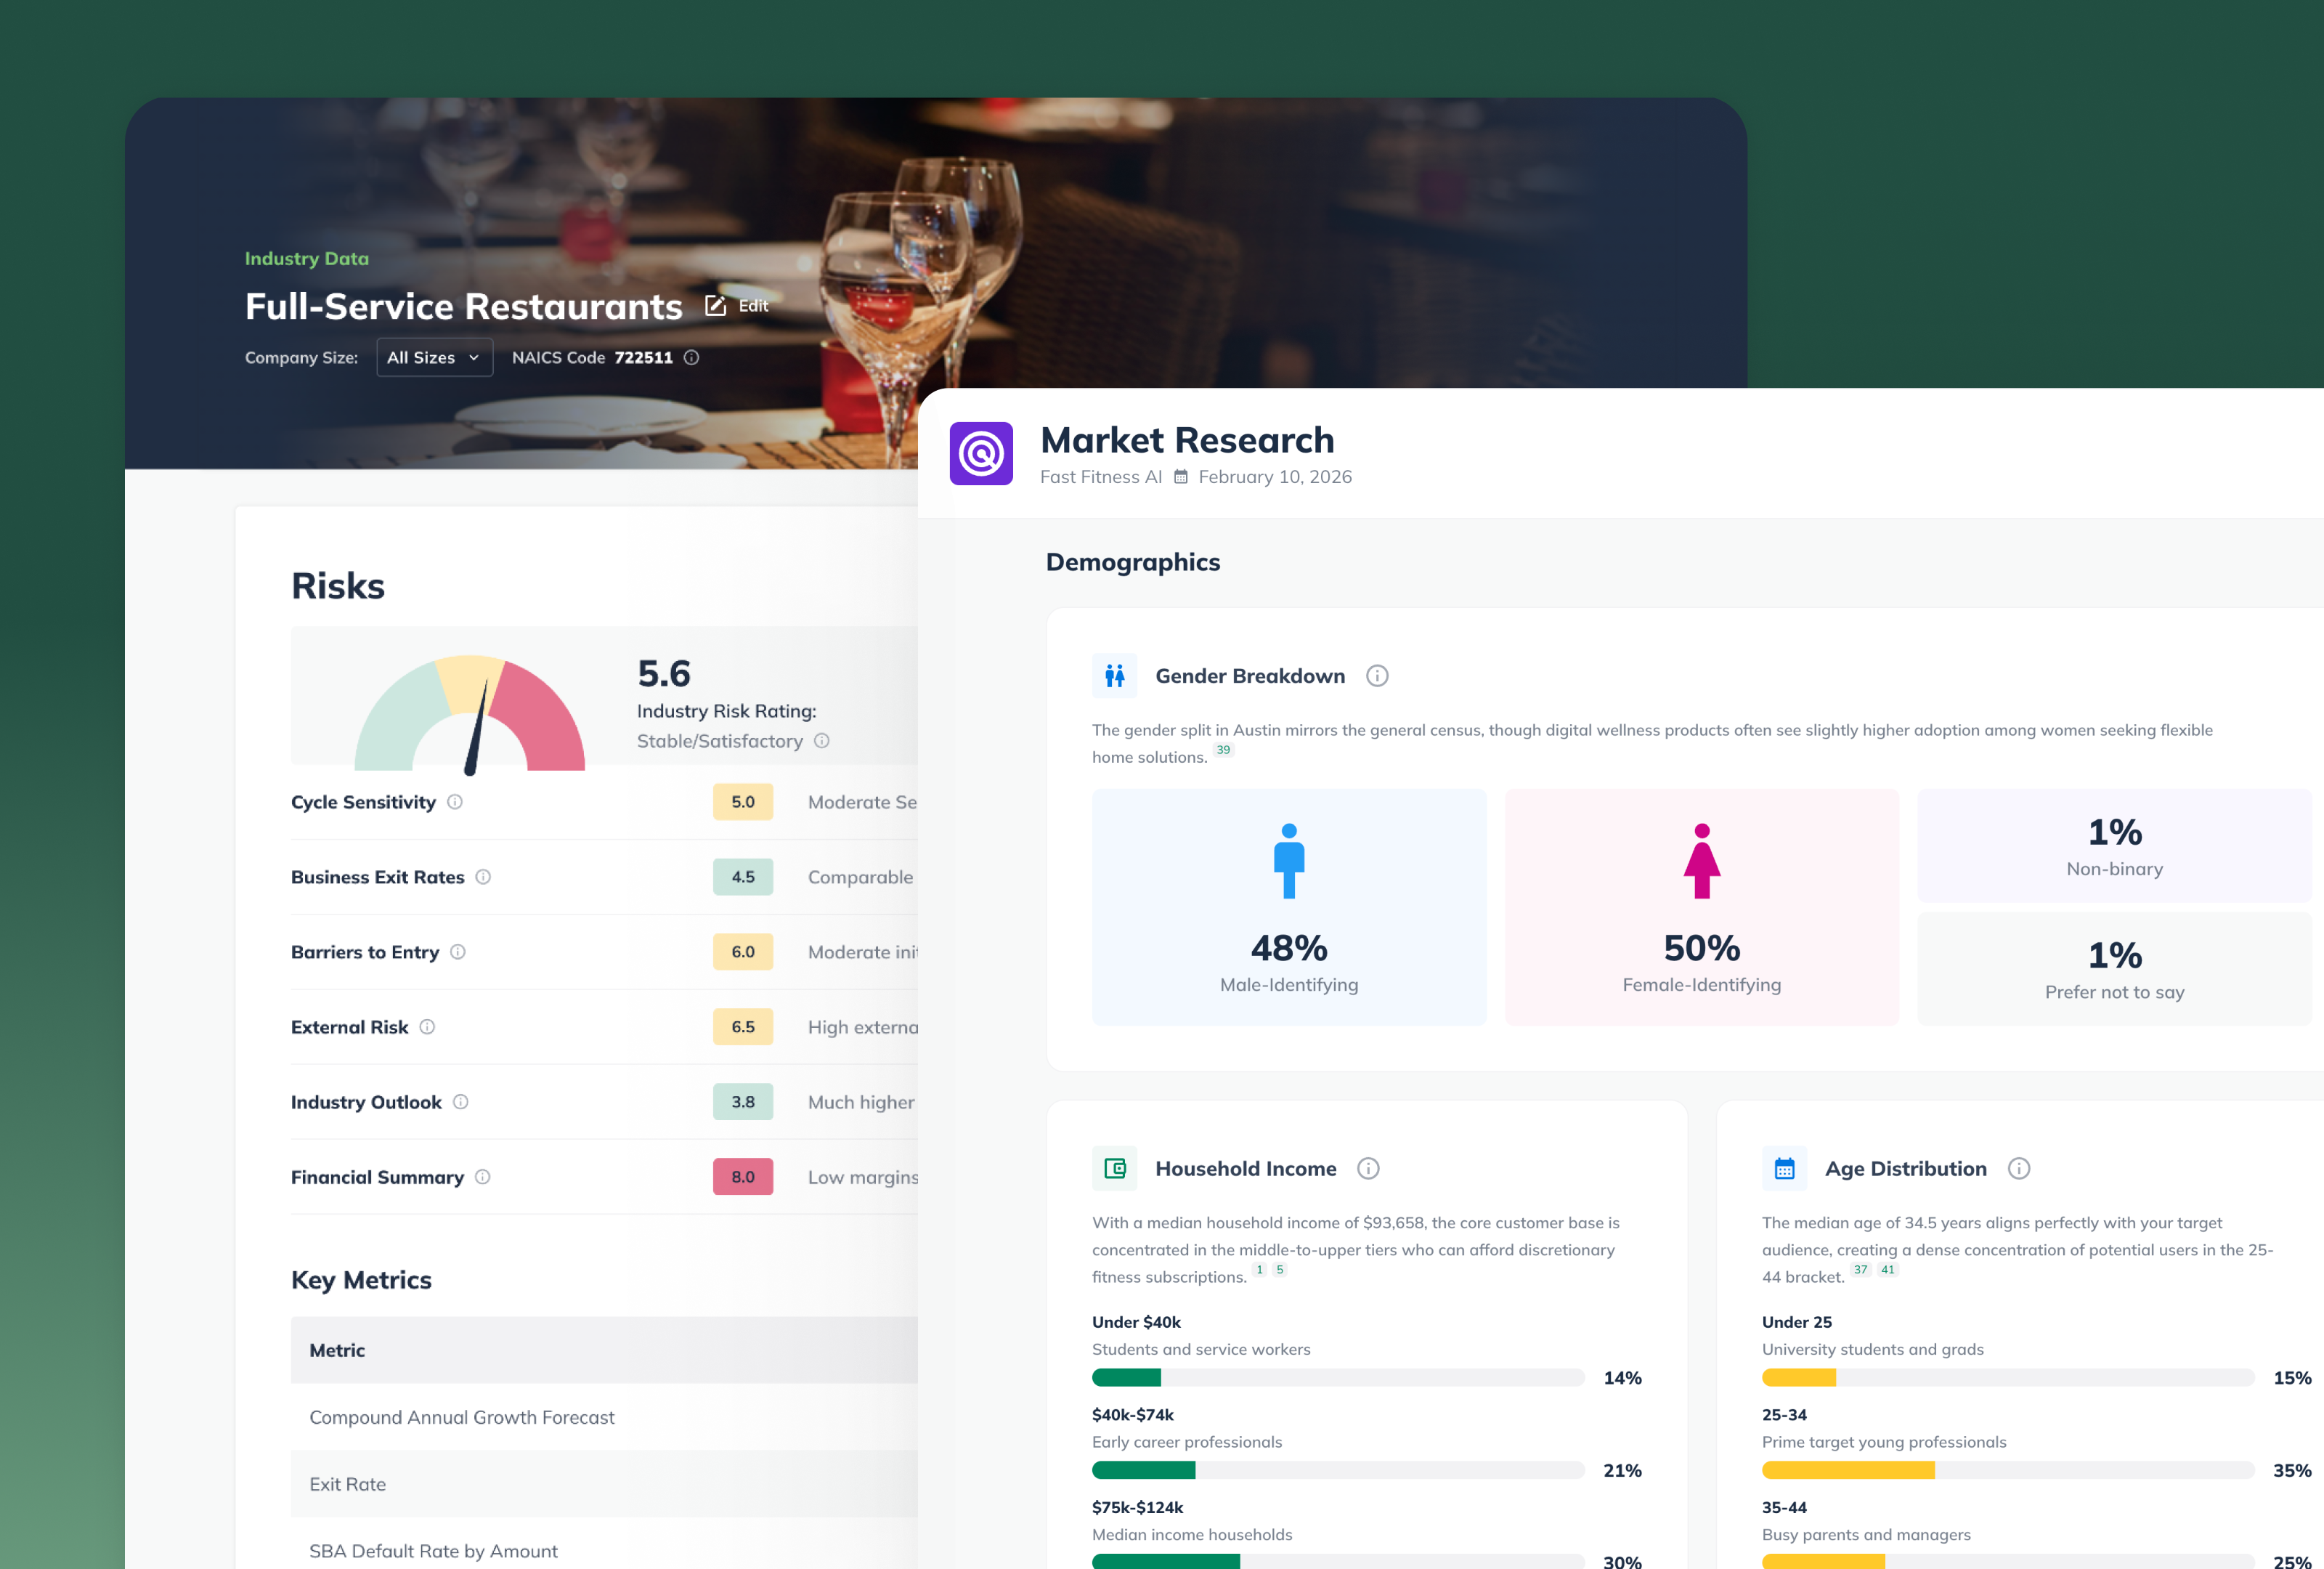
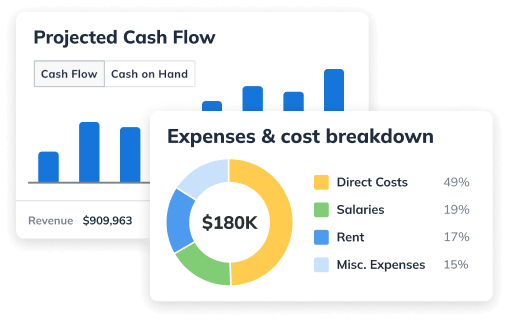
LivePlan's financial forecasting tool builds your P&L, cash flow statement, and balance sheet from a few simple inputs, and keeps them linked. Add a loan once and LivePlan automatically reflects the cash, the liability, the interest, and the repayment schedule across every statement. Industry benchmarks show how your projections compare to similar businesses, and the plan exports in a format SBA lenders recognize.
Ready to walk into your funding meeting with numbers you can defend? See which loans fit with the free Business Loan Finder, then create your financial forecast →
Further reading

Noah Parsons
Before joining Palo Alto Software, Noah Parsons was an early Internet marketing and product expert in the Silicon Valley. He joined Yahoo! in 1996 as one of its first 101 employees and become Producer of the Yahoo! Employment property as part of the Yahoo! Classifieds team before leaving to serve as Director of Production at Epinions.com. He is a graduate of Princeton University.Noah devotes most of his free time to his three young sons. In the winter you'll find him giving them lessons on the ski slopes, and in summer they're usually involved in a variety of outdoor pursuits.Noah is currently the COO at Palo Alto Software, makers of the online business plan app LivePlan.